
.svg)
OpenTelemetry and CRE: Use open standards to proactively detect reliability problems
OpenTelemetry (OTel) continues to see wide adoption because it provides a unified, vendor‑agnostic way to collect traces, metrics, and logs from every component in your stack.
The flip side, however, is noise—OTel can generate vast volumes of telemetry data, much of which may be low‑value. Without a thoughtful strategy for handling this noise, teams can drown in telemetry, obscuring real issues in a sea of data.
Common Reliability Enumerations (CREs) emerged earlier this year as a framework for addressing this general challenge. By treating problem detection expertise as code —you can continuously scan your telemetry for failure patterns that the community has seen.
In this post, we’ll explore how to integrate the two open standards, OpenTelemetry (OTel) and CREs to continuously scan your telemetry for failure patterns. We’ll turn raw telemetry into real‑time detections and we’ll look at real‑world use cases to make it all concrete.
CRE: Reliability Problem Detection as Code
Early detection of reliability problems can mean the difference between a brief hiccup and a full‑blown outage.
Traditional monitoring often relies on ad‑hoc dashboards and manually configured alerts. CREs flips that model providing an open, structured standard for sharing and operationalizing knowledge of reliability problems.
A CRE is essentially a specification of a problem: it includes a unique ID (e.g. “CRE-2025-0007”), a description of the issue, logic for detecting it, and how to fix or mitigate it.
Just as CVEs let us share and detect known vulnerabilities, CREs provide a standardized way to describe reliability issues so that teams can recognize reoccurring failure modes across systems. This works whether a problem is frequent or relatively obscure.
This approach brings software engineering rigor to application monitoring, fostering collaboration between platform teams, SREs, and developers.
If you’re new to CRE and never seen one in action, you can test a sample CRE in the prequel playground. Just click the blue “Test Rule” button.
preq
preq (“preek”) is a free and open community-driven reliability problem detector that consumes CREs and applies them to a variety of data sources.
preq is powered by public CREs that are contributed by the community and Prequel's Reliability Research Team.
For this article, we’ll focus on ways to leverage preq to run CREs against streaming OTel log data.
Non‑Kubernetes Use Case: Sampling the OTel Collector
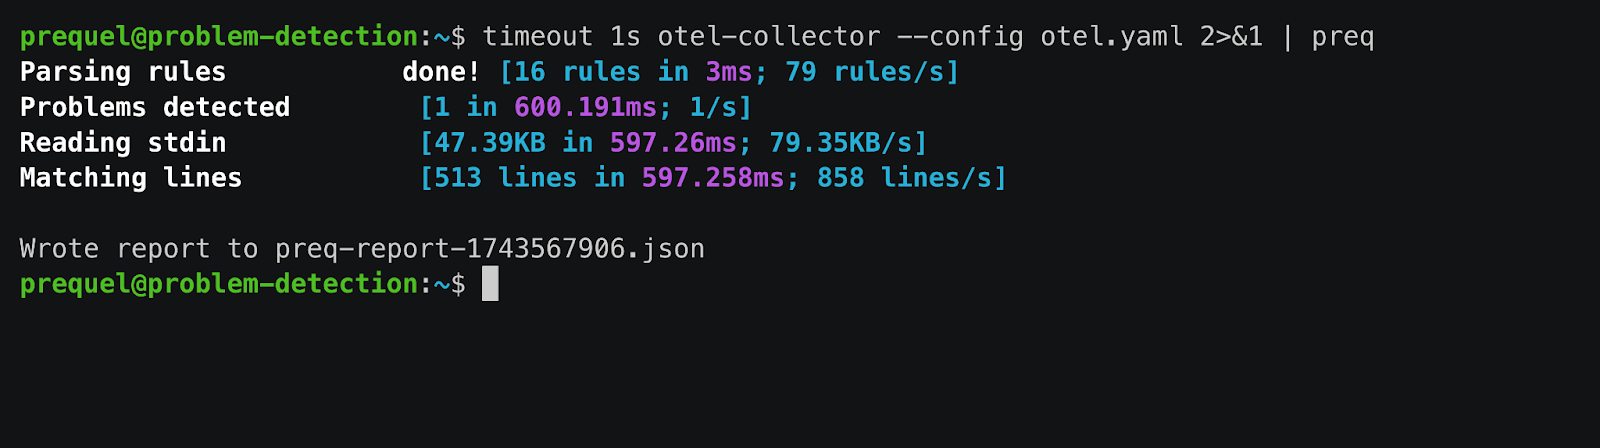
Let’s start with a simple example. Suppose you want to test your CREs against a OpenTelemetry Collector running locally.
If you haven’t done so already, you’ll need to download preq. It is available as a standalone binary for Linux, macOS, or Windows. In this example, we’ll pipe data to it, but you can also schedule it, configure it to locate data sources, or even push slack notifications.
timeout 1s OTel-collector --config OTel.yaml 2>&1 | preq
- (optional) timeout 1s limits the collector to a one‑second run.
- OTel-collector --config OTel.yaml boots the Collector with your instrumentation pipeline.
- 2>&1 merges stderr (errors) into stdout.
- |
preqpipes every log line into Preq, which evaluates each against the public CRE catalog.
Kubernetes Use Case: Live Pod Streaming
If your collector is running as a pod in Kubernetes, install the preq kubectl plugin via krew for easy in-cluster use.
Once the plugin is installed, you can use kubectl to point the plugin at your OTel collector
kubectl preq pod/OTel-collector-xyz -o -
Real‑World CRE Use Cases
Here are a few categories of problems you can detect by combining OTel data and CREs, straight from the community‑maintained public catalog:
The CRE database covers 100s of other use cases.
By pairing CREs and OpenTelemetry via preq, you gain a unified, code‑driven approach to reliability detection. This new automated problem detection architecture ensures you can catch failure modes quickly, consistently, and collaboratively without manually wading through gigabytes of telemetry.


